

Mapping Sonic Environments
Sound Maps
Maps are important tools not only for navigating in landscapes, but also for analysing and planning space. For architects and planners the map is probably the most basic tool: giving information about the spatial distribution of objects, buildings, roads etc. The map abstracts from a spatial experience to a two-dimensional representation, allowing a whole different overview than the ordinary experienced perspective.
Maps of sound are found in many different contexts, most prominently in noise management. Since 2002 all larger cities in EU have been instructed to produce noise maps, displaying long-term averaged noise levels in the city (see the European Commissions webpage on Noise here). But mapping has also been an integral part of soundscape analysis since R. Murray Schafer and The World Soundscape Project. Today sound mapping is being employed as a strategy in city planning, architecture and cultural heritage management.
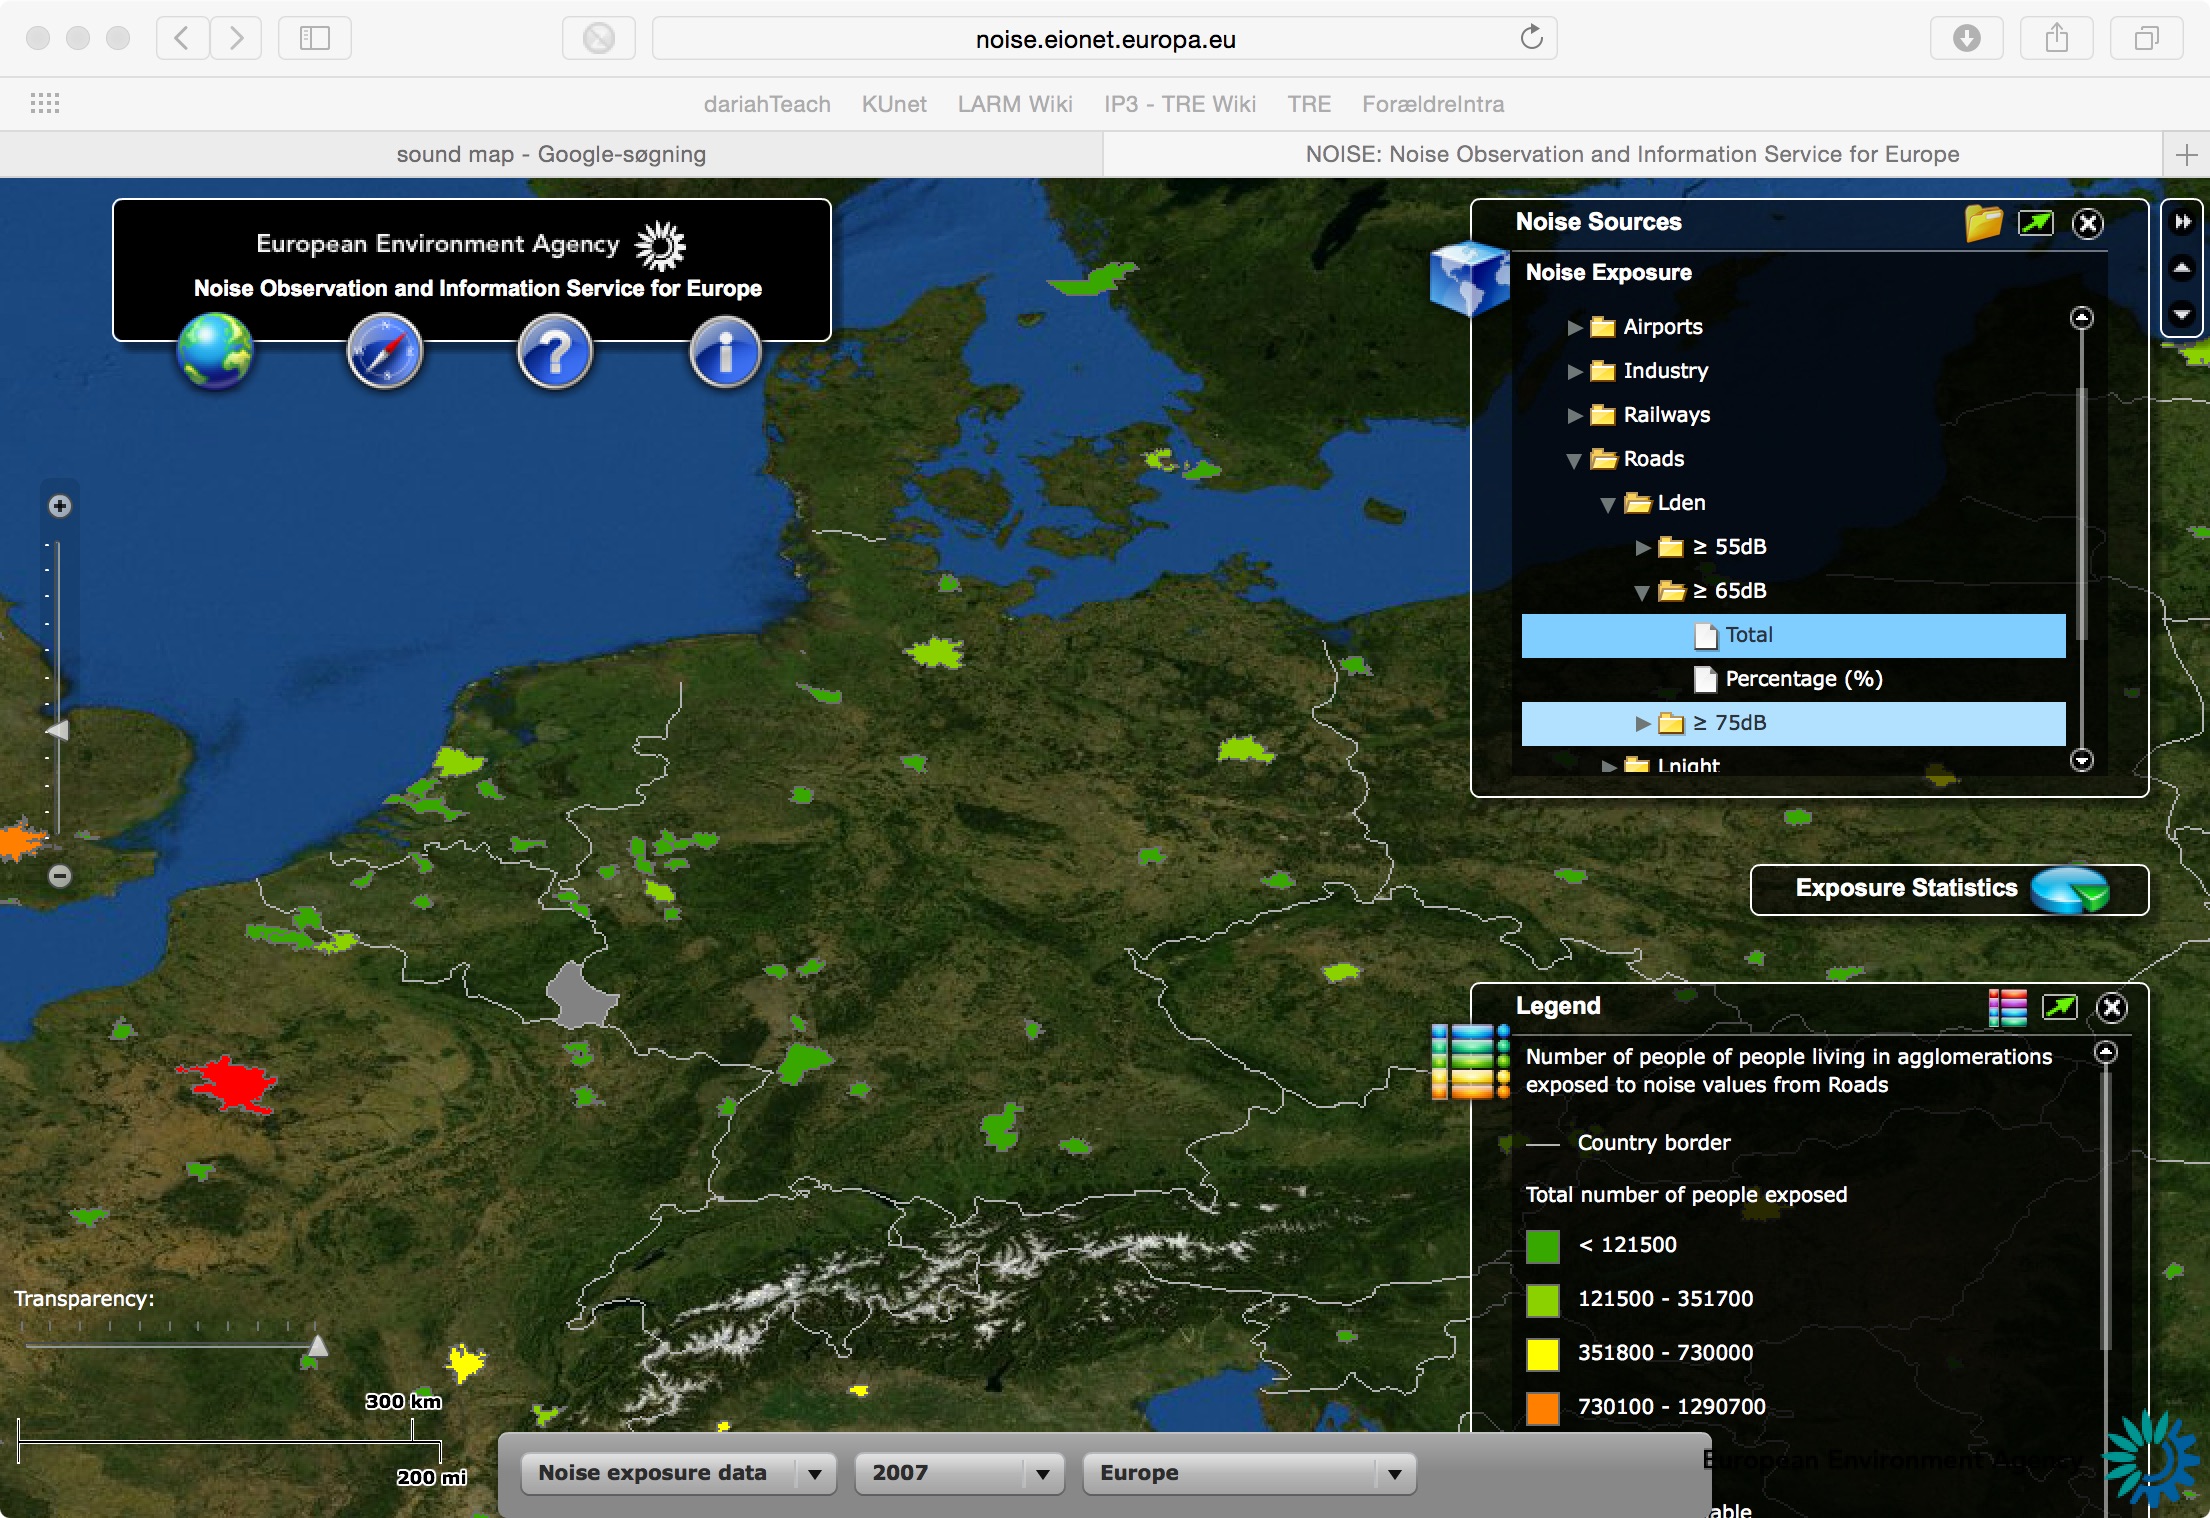
The Noise Observation and Information Service for Europe – NOISE makes results and information from national noise mapping available. Here you can see the respective noise levels on an interactive map like the one shown bellow:
 |
Making maps out of sonic experiences, of course, is not without challenges, since sound much more than vision require temporality. We can observe a photo or a drawing of an object and immediately recognize the similarity between the representation and what is represented. But the sound must be played and unfolded in time, to be experienced. And furthermore, sound is not experienced as a steady quality of a place the same way as a building and a mountain. The sound, a church bell for instance, may be related to the particular place (the church), but unless you are in the place at the exact time of the bell ringing, you will only experience the building and not the ringing. The relationship between the sound and the location is temporary and processual.
For the purpose of strategic noise mapping particular measurements (Leq,16h, Lden and Lnight) are defined, representing an average of respectively 16 wake hours, 24 hours or 8 night hours. Average noise levels are represented by different colours in the noise maps. But not all information about sonic environments is easily translated to quantities and average measures. In fact much of the sensory inputs that determine how we experience a place may be difficult to map: the movement of people, the sounds, the smells – all the fleeting impressions that constitute our sense of here and now.
In L'Invention du Quotidien (The Practice of Everyday Life, 1984) Michel de Certeau distinguishes between two radically different ways of understanding the city: the planning eye watching the city from above and seeing its structure, and the perspective of the pedestrian using and shaping the city in everyday practice. Michel de Certeau talks about the ‘strategies’ of planners in contrast to the ‘tactics’ of the pedestrians, and sees in the map a strategic planner's tool, that represents places while hiding the itineraries, that connect them.
Noticing the difference between the bodily experience of a place and the representation of a place in a map, the question is if sound maps can be understood as a way of trying to introduce a sensory aspect in the mapping logic, or on the contrary if sound mapping is rather to be understood as an attempt at subjecting sonic experience to the same strategic logic as that defining infrastructures and building volumes. Either way sound maps plot the interesting territory between spatial experience and strategic knowledge that appear to be pivotal to modern city planning and architecture.
Suggested reading:
EchoXIII: "How to make a Sound Map: Cartographic, Compositional, Performative"