

2.3 Graphs
2.3.2 Graph Visualisation
In this session, we will try to create more advanced network visualisations. To do so, we'll need to recreate the Karate network we created in the previous session.
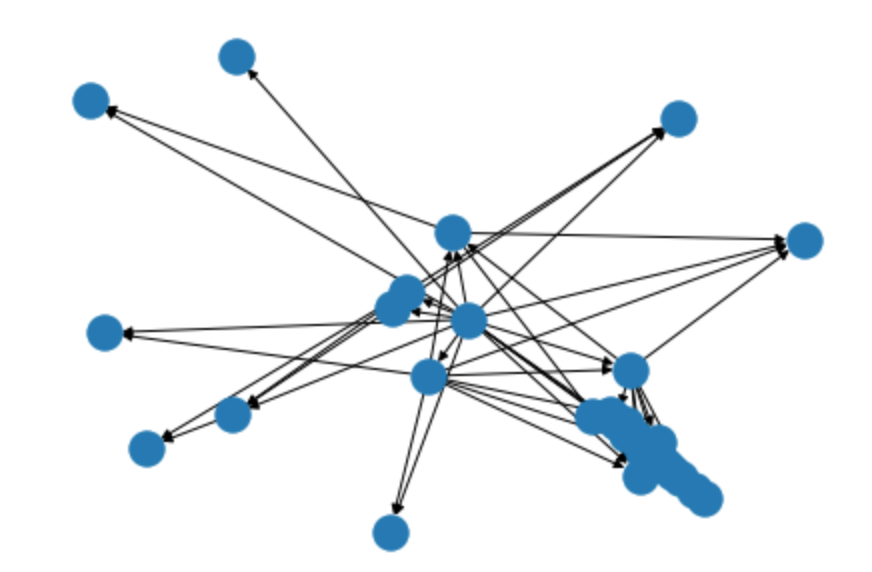
There is a significant number of options to improve this graph. In the notebook, we will, for instance, add the labels, use curved edges and reduce the arrow size.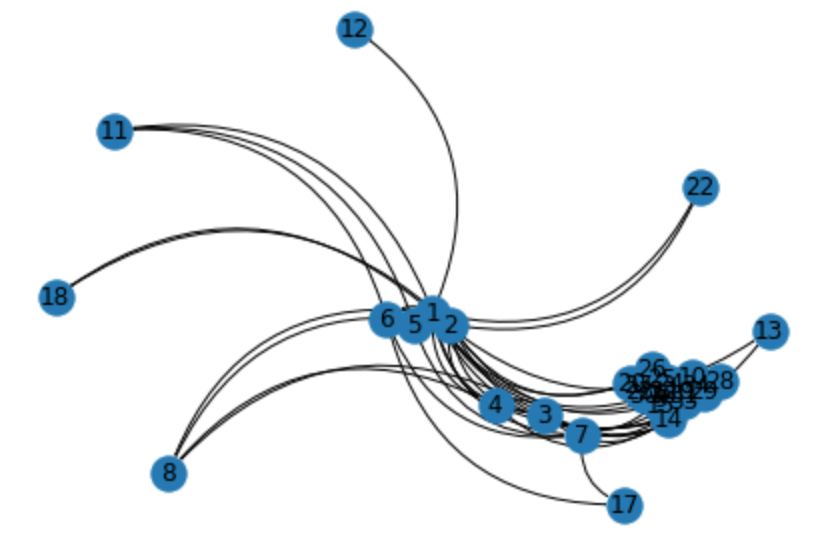
We can also colour our network nodes based on gender and size them based on age.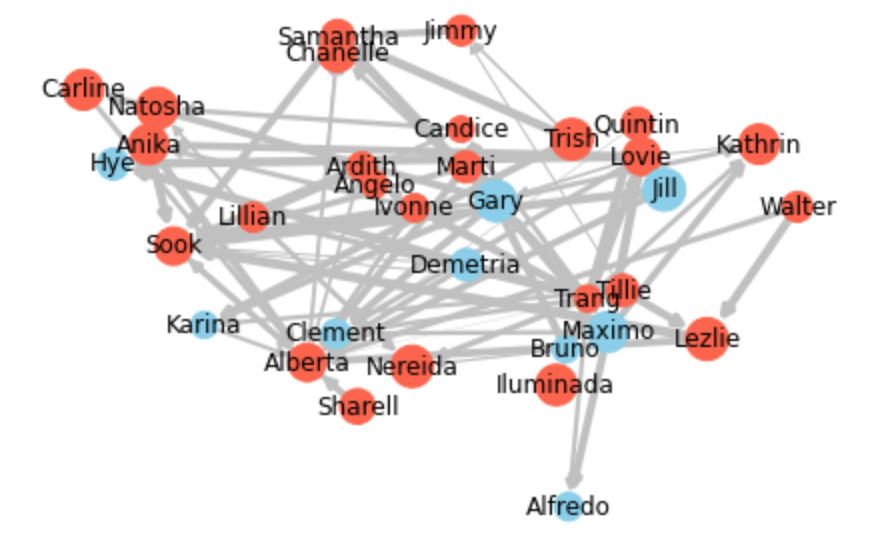
But it is still difficult to see any interesting patterns in the network. Remember, e.g., the original insight from the 1970s paper on the karate club? It described how the larger community of the whole club was effectively the result of several separate communities of members and split, therefore, according to the trust placed in either the administrator or instructor. Thus, the whole karate club community can split up easily. Graph analysis comes with many so-called community-detection algorithms supporting such investigations—more on this in the notebook in Google Colab.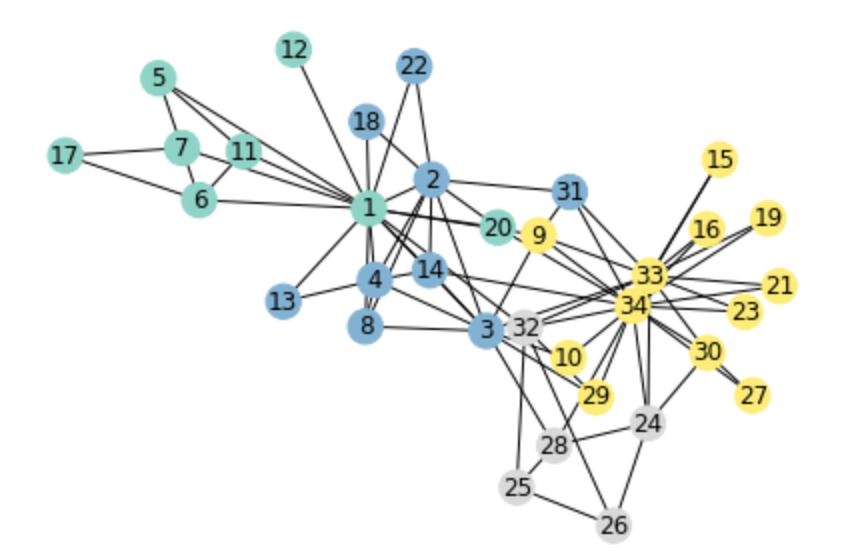
There is a significant number of options to improve this graph. In the notebook, we will, for instance, add the labels, use curved edges and reduce the arrow size.
We can also colour our network nodes based on gender and size them based on age.
But it is still difficult to see any interesting patterns in the network. Remember, e.g., the original insight from the 1970s paper on the karate club? It described how the larger community of the whole club was effectively the result of several separate communities of members and split, therefore, according to the trust placed in either the administrator or instructor. Thus, the whole karate club community can split up easily. Graph analysis comes with many so-called community-detection algorithms supporting such investigations—more on this in the notebook in Google Colab.