2.4 Visuals and Arts
2.4.2 Image Analysis
Up to now, we have mainly used this session to introduce how to produce visuals of data. This is important, but there is also the analysis of images and other multimedia. Next, we discuss a few simple exercises to work with images. We will see that basic image manipulation is simple because images are matrixes and can be manipulated like any other matrix. You might remember matrixes from the introductions. If not, it is good to look them up again. They are similar to data frames but simpler. They contain only one type for all columns. In the case of images, these are pixel values.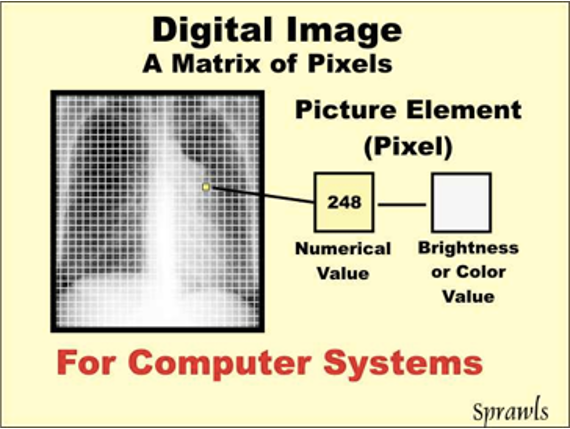
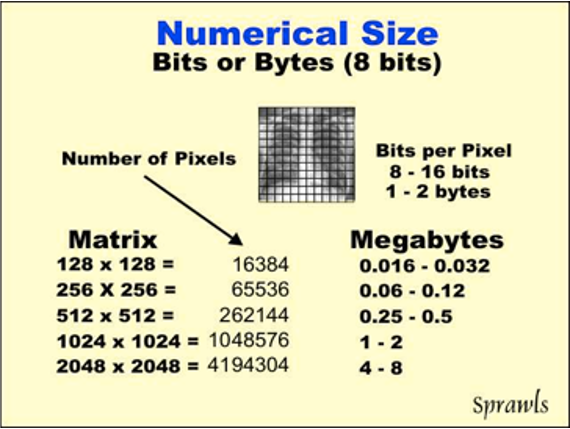
To work with an image in Python, we need to understand what images are in the eye of the computer. As said, they are, first and foremost, matrixes containing pixel values.
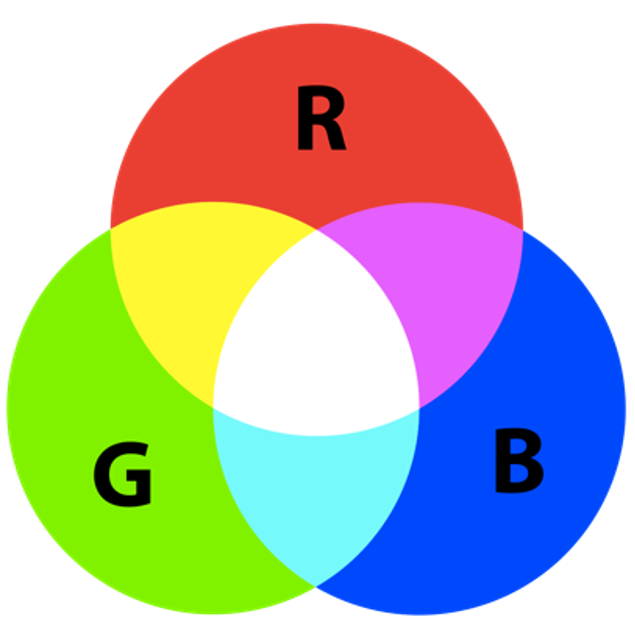
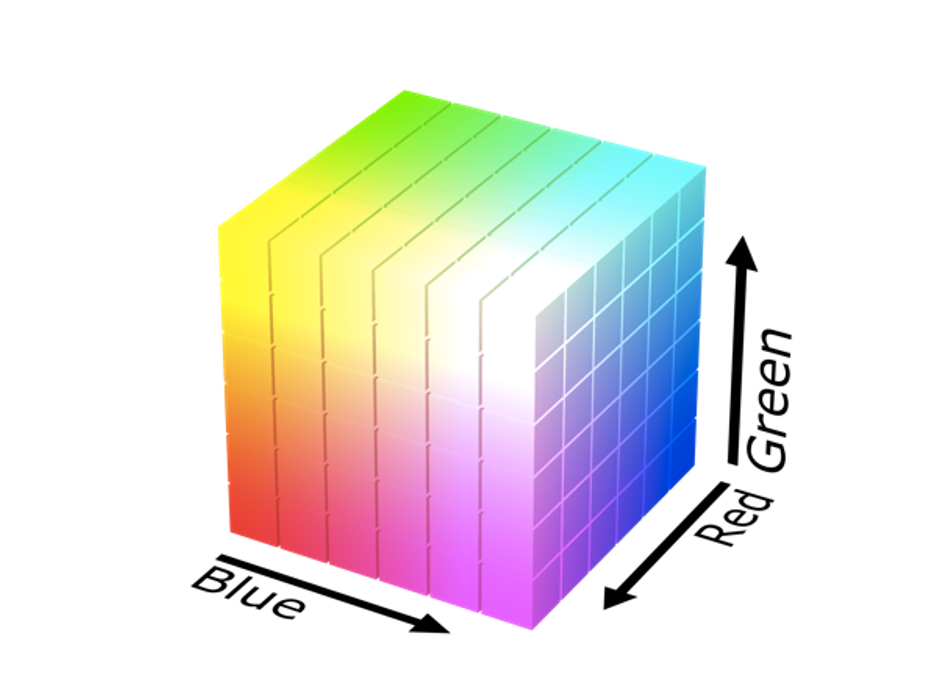
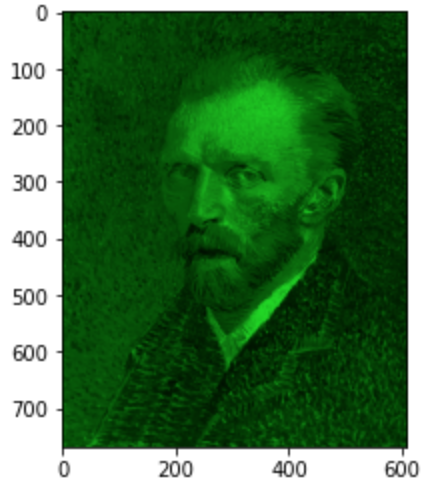
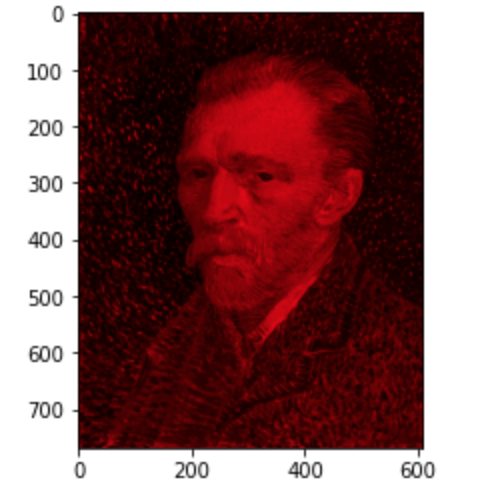
Colour images also include Red-Green-Blue (RGB) information. These RGB channels quantify any colour. Check out https://www.tutorialspoint.com/python_pillow/python_pillow_colors_on_an_image for a detailed explanation, especially the red, green and blue colour coding. A combination of RGB defines any colour for the human eye. This means we need to store all pixels of the image according to its height and width axes, and this has to happen three times because we need one matrix for each RGB colour channel. We need one matrix each for red, green and blue. This leads to a three-dimensional matrix: https://en.wikipedia.org/wiki/Channel_(digital_image).
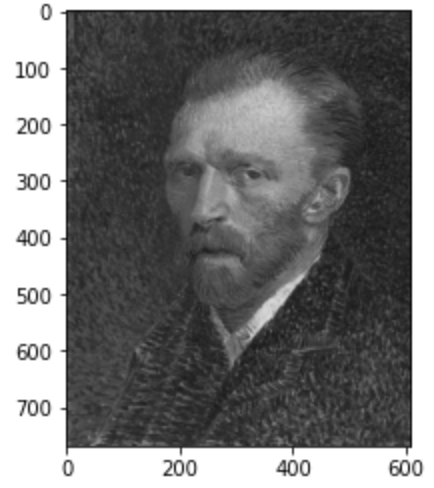
Because we are from Amsterdam, we will work with the famous self-portrait of van Gogh in the Notebook in Google Colab.
References
- Channel (digital image). (2022). In Wikipedia. https://en.wikipedia.org/w/index.php?title=Channel_(digital_image)&oldid=1111471216
- Python Pillow—Colors on an Image. (2023) from https://www.tutorialspoint.com/python_pillow/python_pillow_colors_on_an_image.htm

