

2.3 Translating the Humanities Object
2.3.1 Representing Geographic Concepts Digitally
Once we’ve identified meaningful places, events, or spatial relationships in a humanities project, we’re faced with a fundamental challenge: how should we represent them in a digital, mappable format? In GIS, this process involves making deliberate choices about how to translate real-world (or text-based) phenomena into spatial data, often requiring both technical and interpretive decisions.
Vector Data (Points, Lines, and Polygons)
One of the most common ways to represent geographic features is through vector data, which consists of:
- Points: single coordinate pairs representing discrete locations (e.g., a monument, a café, a city).
- Lines: ordered sequences of points that represent linear features (e.g., roads, rivers, routes).
- Polygons: closed shapes representing areas (e.g., neighborhoods, historical regions, land parcels).
This might seem more straightforward than it is. For example, when mapping locations from Mary Shelley’s Frankenstein, you might choose to represent Victor Frankenstein’s and Clerval’s visit to Edinburgh as:
|
• |
A point marking the city center |
|
– |
A line if you want to reconstruct a likely walking route between landmarks he visits |
|
◊ |
Or a polygon representing New Town (if we know he spent significant time there) |
See, for example, the following rumination on defining geographical locations by Jason Kelly in the context of his Frankenstein Atlas project:
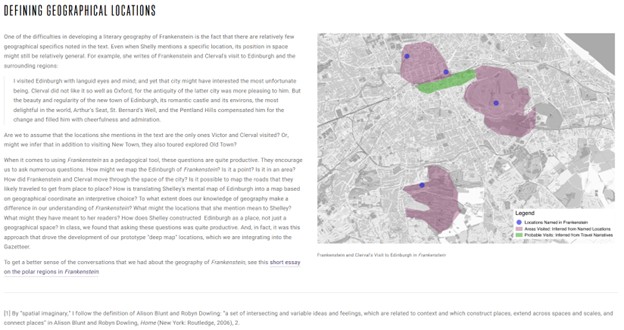
Each of these approaches are valid. Each requires interpretation. What do we lose by selecting one of the options? What do we gain? What’s essential is to be transparent about your choices and understand how different representations can affect the meanings your map conveys.
Raster Data (Fields and Continuous Surfaces)
While vector data represents the world as discrete features (points, lines, and polygons), raster data represents space as a continuous surface divided into a grid of cells (or pixels). Each cell contains a value.
Instead of asking, “Where is this object?” raster data often asks, “How does this phenomenon vary across space?”
A raster might represent:
- Elevation (meters above sea level)
- Temperature
- Population density
- Land cover classification
- Satellite imagery
- Or a scanned and georeferenced historical map
In raster data, space is not carved into bounded objects. Instead, it is treated as a field in which values change gradually from one location to another. If vector data invites us to draw boundaries, raster data invites us to model gradients and intensities. In a humanities context, this can be profoundly useful. Imagine:
- A heatmap showing the density of plague deaths across London in 1665
- A surface representing the concentration of newspaper mentions of “revolution” across France in 1789
- A raster layer of elevation shaping how we interpret the travel of a medieval pilgrim
In each case, we are not mapping a bounded object. We are modeling spatial variation.
Raster and Historical Maps
Raster data is also central to working with historical maps. When you scan and georeference an 18th-century map of Edinburgh, the result is a raster image aligned to modern coordinates. That image is not vectorized; it is a grid of pixels whose spatial alignment allows it to be layered with modern GIS data.
This raises new interpretive questions:
- What projection was the original map based on?
- What distortions does it contain?
- What happens when we align a historical imagination of space with modern spatial reference systems?
Raster, here, becomes a tool of translation, and sometimes tension, between past and present spatial logics.
From Raster to Vector: Digitizing as Interpretation
Raster and vector data are not isolated categories. In practice, researchers might move between them.
Consider the aforementioned 18th-century map of Edinburgh (or a contemporary aerial photograph). Once georeferenced, it exists as a raster image, or a grid of pixels aligned to real-world coordinates. But that raster image can become the basis for new vector data.
A researcher might:
- Create a new point layer marking key sites mentioned in Frankenstein
- Trace historical roads as line features
- Delineate districts such as New Town as polygons
This process, often called heads-up digitizing (or on-screen digitizing), involves manually or semi-automatically tracing features from a raster image to create vector geometries.
Here again, interpretation is unavoidable. Where does a road begin and end on an old map? Is a district boundary clearly defined, or softly implied? What counts as a feature worth tracing?
Digitizing is not merely technical conversion. It is a form of spatial argument.
Applying a Humanities Lens: Modeling what Resists Boundaries
Some humanities phenomena resist neat geometric containment:
- Memory
- Influence
- Fear
- Sacredness
- Rumor
- Cultural belonging
Raster representations can sometimes better approximate these diffuse qualities, but they also risk suggesting smoothness where historical experience was jagged and uneven.
The question is not quite “vector or raster?” It is: What conception of space does this model assume (and preclude), and does it align with my argument?
 Exercise: Expressed as Vector
Exercise: Expressed as Raster
Choosing between them is not just a technical matter. It reflects how you conceptualize the phenomenon you are studying. Is a plague outbreak a bounded zone (polygon) or an intensity surface spreading across parishes (raster)? Is Edinburgh a point or a field of narrative presence?