

4.3 Evaluation of Phygital Heritage
4.3.1 Observation
Observation
During the experimental part of the first scenario [Nofal et al, 2018] presented in the previous lesson (4.2.2), all participants’ interactions were video-recorded and observed, and then manually listed and analyzed in an Excel spreadsheet. The level of user engagement was derived by the duration of interaction, the apparent focus of attention while interacting and any form of social interaction with other person(s) nearby. The resulting observation data was chronologically mapped and then labelled in terms of user behavior, such as whether a participant focused on the navigation or the representation component, or both simultaneously; or whether they started discussing with each other; and whether these social interactions targeted the purpose of the installation or the sharing of their preliminary comprehension of it. We also logged any discussion with the interviewer, and whether and for how long they looked at the informative poster.Participants focused their attention on varying aspects during the interactive exploration process of each condition. The analysis demonstrates the chronological analysis of the three conditions, each row in the figure maps the interactions of a single participant along a horizontal timeline. Consequently, more yellow (i.e., focus on representation) can be noticed in condition Tang-Dix, while the green color (i.e., focus on navigation) can be noticed more during the interactions with conditions Touch-Dix and Tang-Phys. These patterns denote that condition Tang-Dix encouraged participants to focus more on the representation element (digital display), while the other two conditions (Touch-Dix and Tang-Phys) allowed participants to distribute their attention on both the representation (i.e., the digital display and 3D physical rendition) and the navigation (touch screen and tangible installation) elements.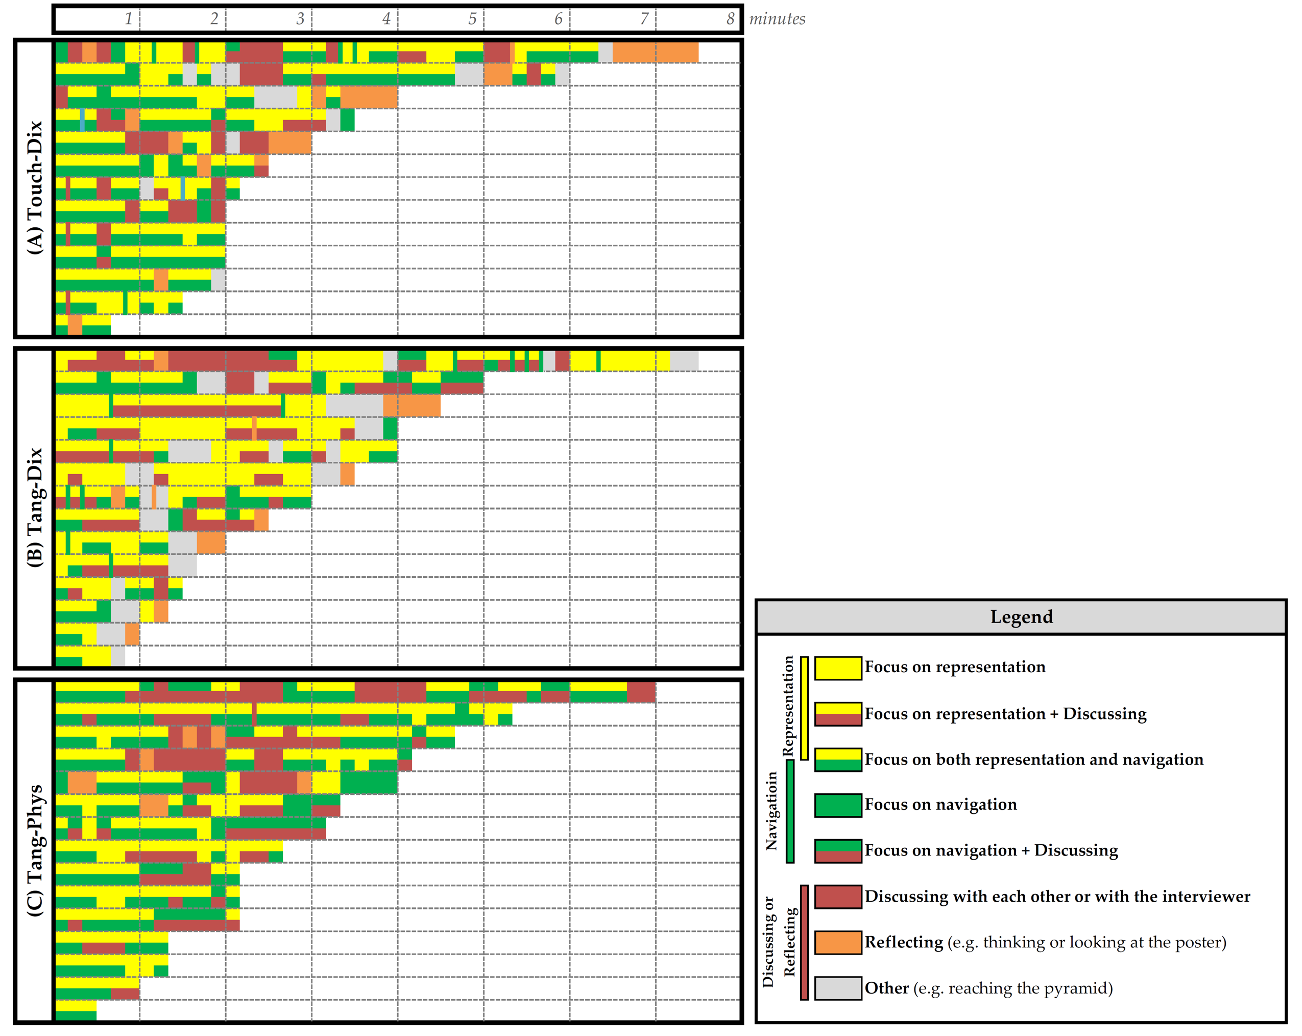 |
|
Chronological analysis of the participants’ focus of attention while interacting with the three conditions of Saqqara Entrance Colonnade (Nofal et al, 2018) |
In the second scenario (4.2.3) and during AR Visiting Experience [Nofal et al, 2018], all the interactions were video-recorded, observed and manually analyzed in an Excel spreadsheet. The level of user engagement was derived by the duration of their interaction, their apparent focus of attention while interacting and their social interactions with other person(s) nearby. Furthermore, we manually noted the ‘angle of view’ for each participant while interacting with the AR application from the video recordings. We then graphically labelled the ‘angle of view’ in two phases: (a) as an Initial Interaction to evaluate whether and how people found the application intuitive to use, and (b) as a Guided Interaction after advising participants to look around in order to evaluate whether and how the architectural context is communicated. Their tilting angle was also noted to observe whether they looked down to the floor or looked up to the ceiling. The movement of the participants was also observed and noted, such as whether they moved right, left, or towards the physical object while holding the tablet.
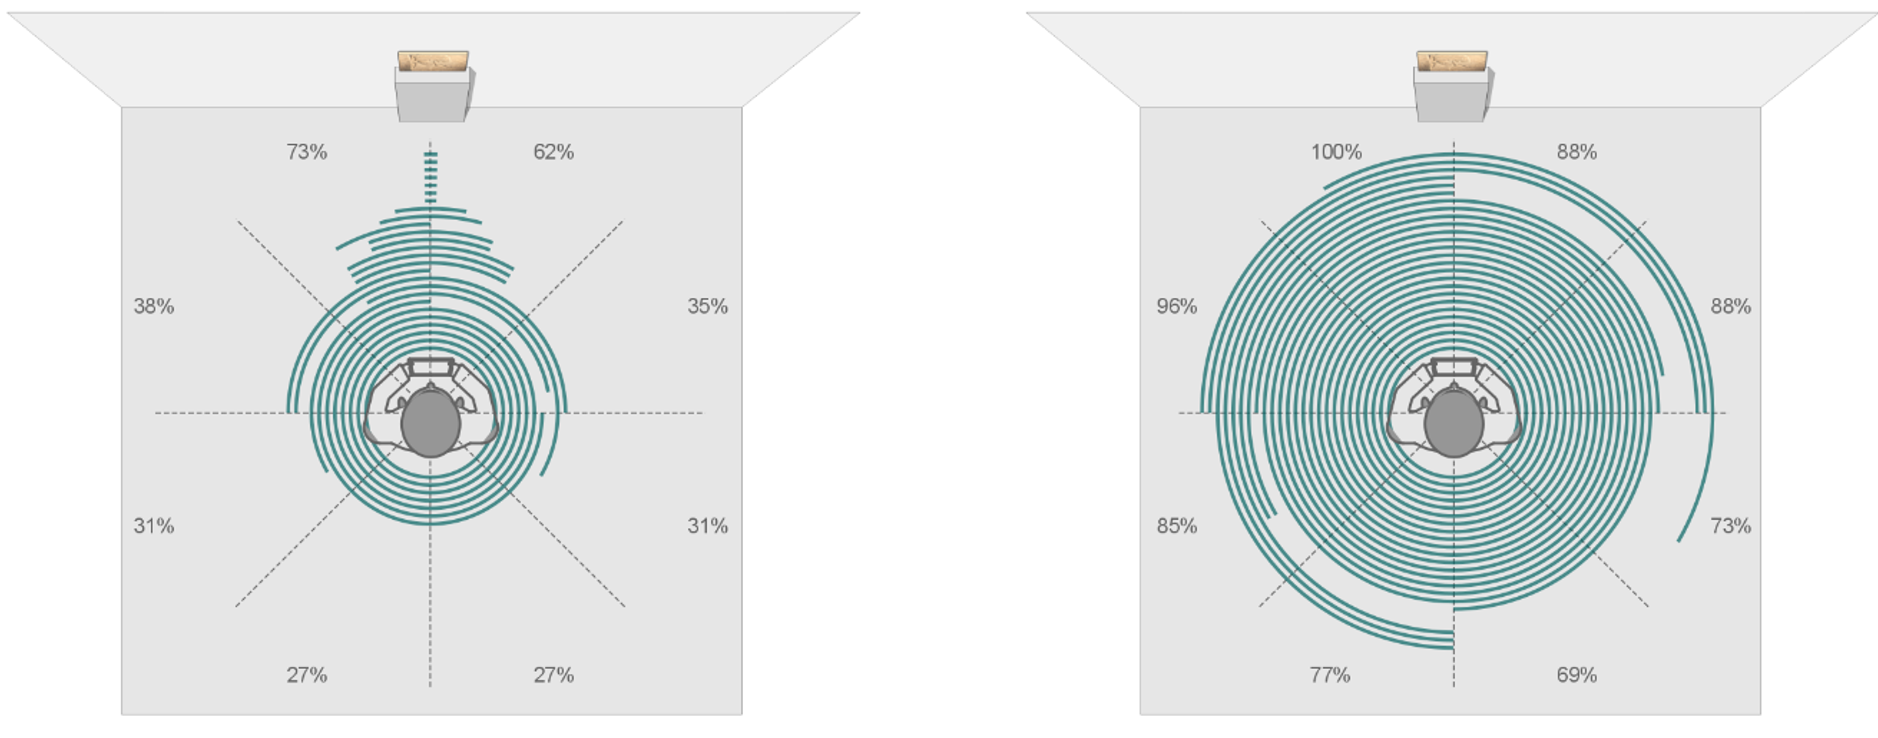
The figure below shows a top view of a participant holding the tablet, demonstrating the focus intensity for looking at the different angles of view during the interaction. Consequently, more arcs (i.e. number of participants) can be noticed in the angles in front side, close to the physical exhibited artifact, while only a limited number of participants (i.e. 27%) looked at the back side of the room during their Initial Interaction despite of the animated pop-up.
 |
|
Participants’ focus of attention in terms of ‘angle of view’ in their AR experience the phygital example of Nimrud Relief (each green arc represents the total angle of view of one participant, indicating the percentage of participants for each angle): (a) is an Initial Interaction, while (b) is a Guided Interaction after telling them that they can look around (Nofal et al, 2018). |
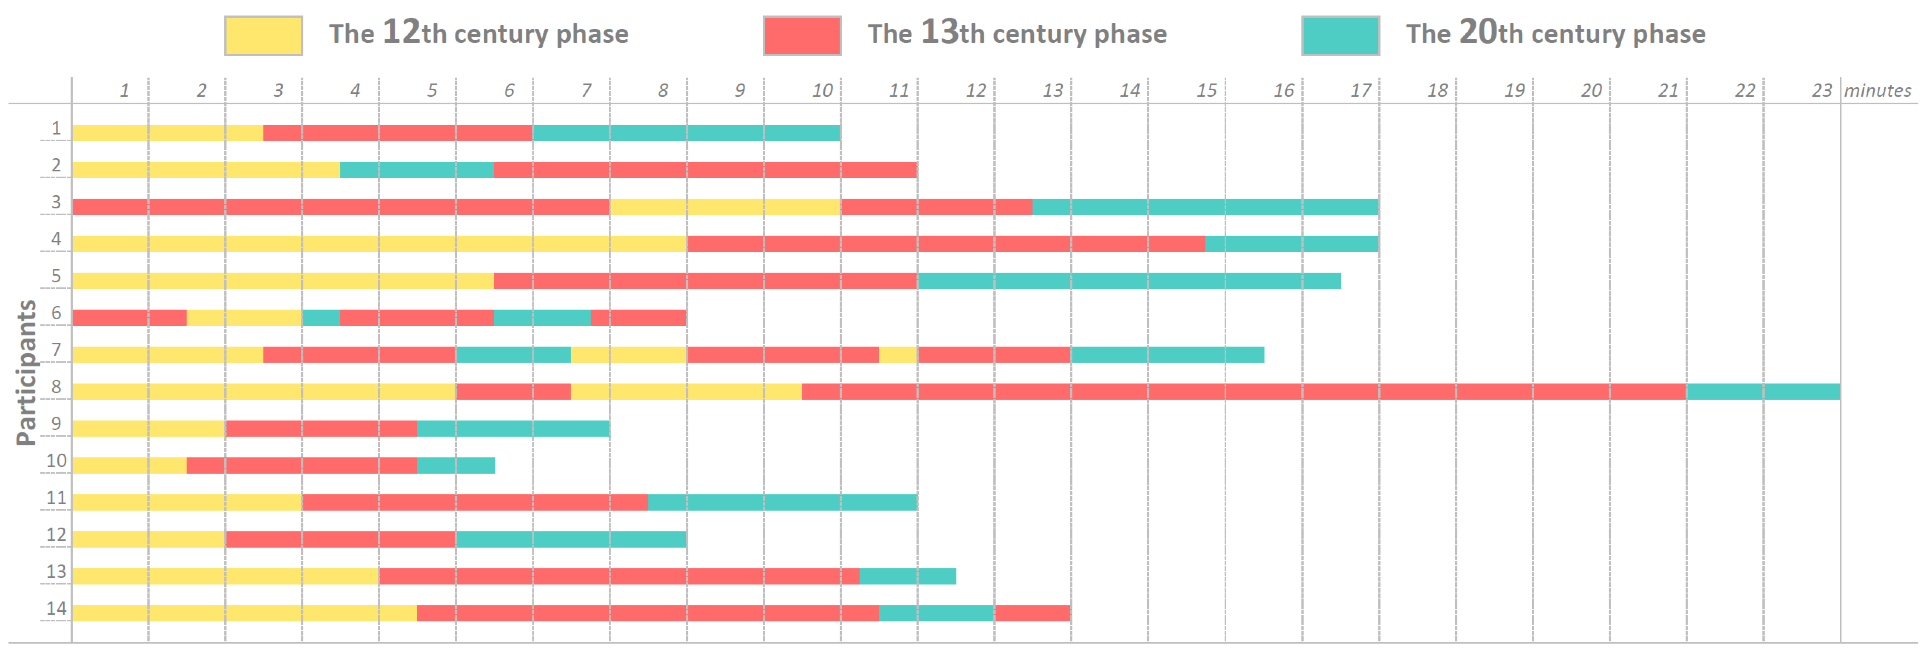
In the third scenario (4.2.4), we also observed and manually analyzed the interactions of participants [Nofal et al, 2018]. From the video recordings, we graphically labelled the time of interaction of each building phase for each participant. We also observed whether visitors mapped the physical models with what they perceived via the projection content, or whether they were able to make meaningful comparisons among the building phases.
The chronological analysis shows that participants spent much more time interacting with the 13th-century model compared to the 12th-century model. This might be due to the higher number of details in that building phase, which is relatively divergent from the current state of the chapel. In contrary, participants spent the least amount of time interacting with the 20th-century model, which was expected as there was almost no differences with the current state to notice.
 |
|
Chronological analysis of participants’ interaction with the phygital example of Graethem Chapel (Nofal et al, 2018). |
In the fourth scenario (4.2.5), the pupils’ interactions were observed and video-recorded, and then manually listed and analyzed in an Excel spreadsheet [Nofal et al, 2020]. The causal aspects of situatedness where captured by observing whether, when and which groups went inside the original tomb-chapel, and how this steered their game-solving and according learning activities. We manually noted all relevant collaborative and social interactions among groups, such as via talking (e.g. reviewing or guiding each other), or via actions (e.g. solving together or dividing the tasks among themselves). Further, we combined the durations of each game together with the human behaviors to determine the overall usability, such as whether the pupils easily understood the game rules and whether they paid attention to the progress bar.
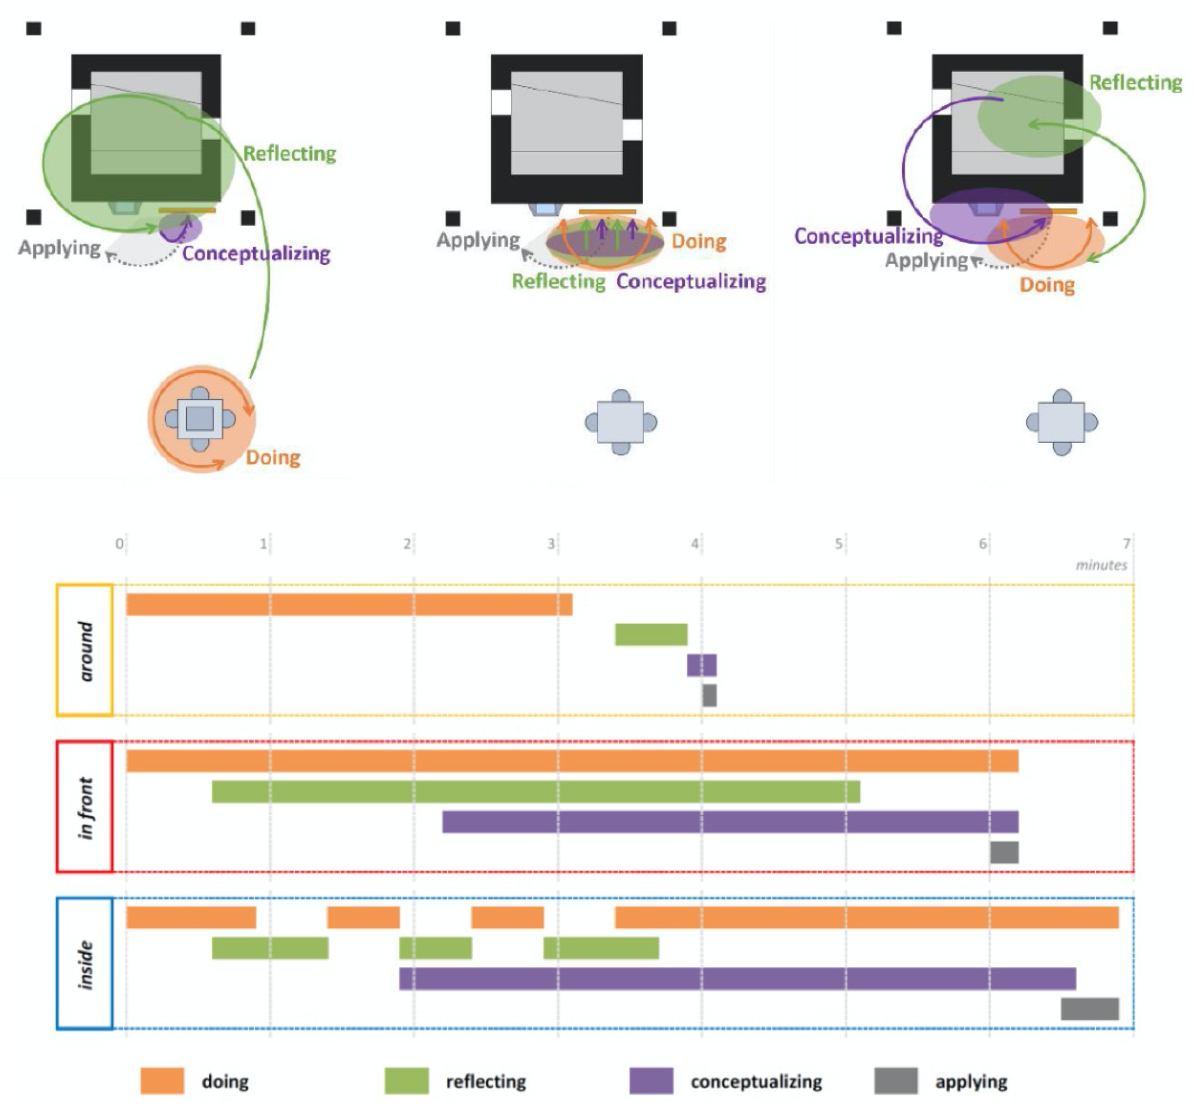
Our results on cultural learning are adapted from Kolb’s model of experiential learning [Kolb, 1984]. This model has been increasingly popular in museum interpretation and education programs, as it frames the process of knowledge creation through the transformation of experience, starting from how pupils have a concrete experience (doing), followed by a reflective observation (reflecting) and an abstract conceptualization (conceptualizing), and ending with the active experimentation of the knowledge they gained (applying) by empirical testing the implications of the seen concepts. Accordingly, the three game setups distributed the learning cycle of young visitors in terms of how they occurred in space and time in significantly differing ways.
In general, the learning stages of the ‘around’ game setup were spatially dispersed between the table to the tomb-chapel passing by the replica wall, and temporally sequential with several gaps in-between. While, the learning stages were more clustered in the ‘in front’ game setup in both space and time, occurring in front of the replica wall and overlapping in time. In the ‘inside’ game setup the learning stages were spatially contained in front of the replica wall and inside the tomb-chapel, and temporally intermittent, meaning that learning stages were not always continuous.
 |
|
Top: Spatial distribution of the four learning stages for the three game setups: (a) dispersed in the ‘around’ game setup, (b) clustered in the ‘in front’ game setup, and (c) contained in the ‘inside’ game setup. Bottom: Timeline of the four learning stages for the three game setups (average of the 14 school visits): sequential in ‘around’, clustered in ‘in front’, and intermittent in ‘inside’ (Nofal et al, 2020). |
References:
- Kolb, D.A. (1984). Experiential Learning: Experience as the Source of Learning and
- Development. Englewood Cliffs, NJ: Prentice Hall.
- Nofal, E.; Reffat, R. M.; Boschloos, V.; Hameeuw, H.; Vande Moere, A. (2018). The role of tangible interaction to communicate tacit knowledge of built heritage. Heritage 2018, 1 (2), pp. 414-436, DOI: https://doi.org/10.3390/heritage1020028
- Nofal E., Elhanafi A., Hameeuw H., Vande Moere A. (2018). Architectural Contextualization of Heritage Museum Artifacts Using Augmented Reality. Studies in Digital Heritage (SDH), 2(1), 42-67, DOI: https://doi.org/10.14434/sdh.v2i1.24500
- Nofal E., Stevens R., Coomans T., Vande Moere A. (2018). Communicating the Spatiotemporal Transformation of Architectural Heritage via an In-Situ Projection Mapping Installation. Digital Applications in Archaeology and Cultural Heritage (DAACH), 11C (2018) e00083, DOI: https://doi.org/10.1016/j.daach.2018.e00083
- Nofal E., Panagiotidou G., Reffat R.M., Hameeuw H., Boschloos V., Vande Moere A. (2020). Situated Tangible Gamification of Heritage for Supporting Collaborative Learning of Young Museum Visitors. ACM Journal on Computing and Cultural Heritage (JOCCH), 13 (1), Article No. 3, DOI: https://doi.org/10.1145/3350427