2.1 Capturing Colour, Texture, and Geometry
2.1.2 Texture & Colour
Texture
|
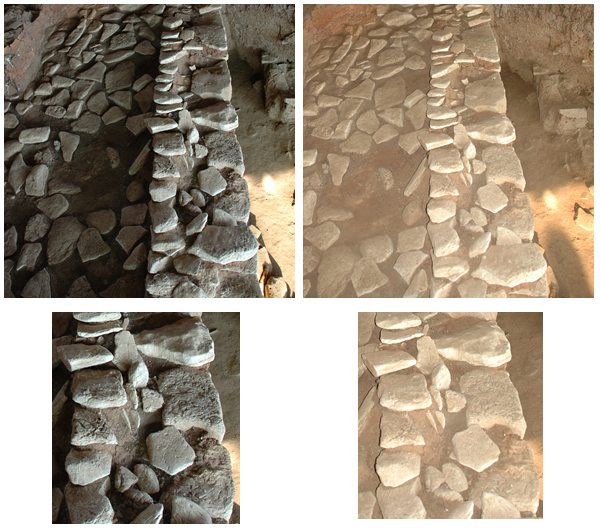
Photograph of a wall under different lighting conditions. Left: Wall lit by indirect light, Right: Wall lit by direct flashlight and indirect light (Click to Enlarge). |
In order to better describe the reflectance properties of objects’ surfaces several functions have been formed; these depend on the refractive index and the texture of the surface, and account for the interaction of light with both micro and macro morphology, as well as the viewer. The most known of these mathematical models is the Bidirectional Distribution Function (BRDF) (Nicodemus 1965), which describes how light is reflected when it comes in contact with a surface. On the other hand, some surfaces are more complex and BRDF is not adequate to define the interaction of light with their textural properties. For this reason, Bidirectional Texture Function (BTF) (Dana et al. 1999), which is related to the spatial variations of BRDF due to the complexity of some textured surfaces along with different viewpoints, has been formed. Both BRDF and BTF can be measured by RGB devices, such as cameras, or a combination of reflectometers/gonioreflectometers and spectrometers, which identify light’s intensity in the whole object or particular areas of the object by taking multiple measurements from different directions.
![]() Drag and Drop: Bidirectional Distribution Function & Bidirectional Texture Function
Drag and Drop: Bidirectional Distribution Function & Bidirectional Texture Function
|
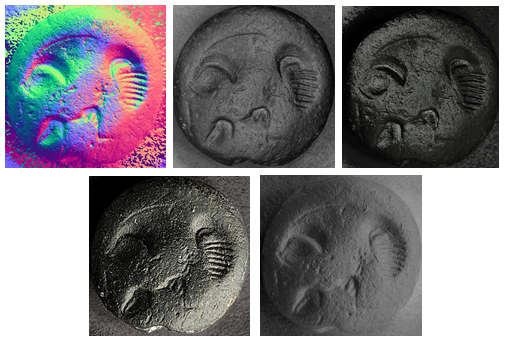
Reflectance Transformation Imaging on a seal made of steatite from Zominthos, Crete. From top left to bottom right: Normal maps, CoefficientA5, Specular Enhancement, Luminance Unsharp Masking, Coefficient A3. (Click to Enlarge) |
Colour
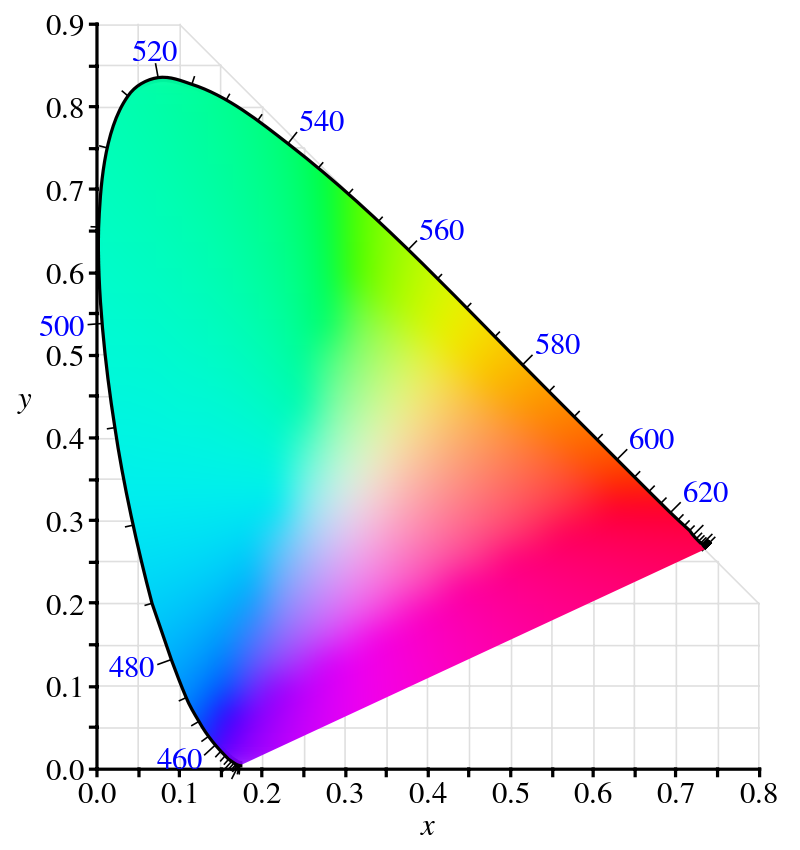
The definition of colour depends on the principle of trichromacy, i.e. the long, medium and the short wavelengths absorbed by our eyes (through the retina), which are then turned into colours. Since the perception of colour is based on the absorption and processing by the retina and the brain of different wavelengths, which respond to three primary colour, i.e. red, green and blue, the way to measure those is to find the means to make instruments that mimic the way that the retina works.In 1931, the Commission Internationale de l'Eclairage (CIE), specified the so-called CIE XYZ colour space, according to which a perceived colour is a tristimulus value (X, Y, Z channels), indicating the luminance and chromaticity of a stimulus as it is perceived in a 2-degree (or 10-degree according to later experiments) field around the foveal centre (see for example Giorganni and Madden 2008: 10-18). The CIE 1931 Colour System is the international standard model of human colour vision on which everything that you see or do is based upon; from a printed page of an article to how the page you are currently reading is rendered on your monitor. Essentially, the CIE 1931 colour system helps us describe numerically a colour and reproduce it in different forms (e.g. monitor, printer etc.).
The techniques that measure the colour of light employ red, green and blue filters to calculate the level of light’s absorption after it has been reflected off particular surfaces. This method which is called colorimetry, and was initially based on experimental colour matching approaches, has evolved to more accurate and automated processes involving advanced instruments that measure colour as a tristimulus value, as well as its temperature, spectral power distribution and spectral reflectance (Hunt and Pointer 2011, p. 99-116). However, colour’s perception in the real world significantly differs since it heavily relies on perceptual and cognitive factors. This may mean, for example, that black and white may have the same intensity if photographed under certain conditions (e.g. under sun and under shade). This indicates that when colour is only considered as a value, it does not incorporate contextualised information regarding its appearance in the real world.
References
- Earl, G., Martinez, K. and Malzbender, T. (2010). Archaeological Applications of Polynomial Texture Mapping: Analysis, Conservation and Representation. Journal of Archaeological Science 37, 2040-2050. https://doi.org/10.1016/j.jas.2010.03.009
- Hunt, R. W. G. and Pointer, M. R. (2011). Measuring Colour (First Edition 1987). United Kingdom: John Wiley & Sons Ltd.
- Malzbender, T. Gelb, D. and Wolters, H. (2001). Polynomial Texture Maps, In Proceedings of the 28th Annual Conference on Computer Graphics and Interactive Techniques (SIGGRAPH2001), pp. 519-528, ACM Press: New York, NY, USA. https://doi.org/10.1145/383259.383320
- Mudge, M., Malzbender, T., Chalmers, A., Scopigno, R., Davis, J., Wang, O., et al., (2008). Image-Based Empirical Information Acquisition, Scientific Reliability, and Long-Term Digital Preservation for the Natural Sciences and Cultural Heritage, In Roussou, M. and Leigh, J. (eds) 29th Annual European Association for Computer Graphics April 14-18, 2008, Crete, Greece. Eurographics Association. http://dx.doi.org/10.2312/egt.20081050
- Mudge, M., Voutaz, J., Schroer, C. and Lum, M., (2005). Reflection Transformation Imaging and Virtual Representations of Coins from the Hospice of the Grand St. Bernard, In The 6th International Symposium on Virtual Reality, Archaeology and Cultural Heritage (VAST2005), pp. 29-39. Eurographics Association. http://dx.doi.org/10.2312/VAST/VAST05/029-039
Further Reading
- Dana, K. J., Ginneken, B. VanNayar, S. K., and Koenderink, J. J. (1999). Reflectance and Texture of Real World Surfaces, In ACM Transactions on Graphics 18(1), 1-34. https://doi.org/10.1145/300776.300778
- Giorganni, E. J. and Madden, T. E. (2008). Digital Color Management. Encoding Solutions (First edition 1998). United Kingdom: John Wiley & Sons Ltd.
- Nicodemus, F. E., Richmond, J. C., Hsia, J. J., Ginsberg, I. W., Limperis, T. (1997). Geometric Considerations and Nomenclature for Reflectance. Washington, DC: National Bureau of Standards, US Department of Commerce.
- Stone, M. (2003). A field guide to digital color. Natick, Massachusetts: CRC Press.


